Blockchain InsightsOsmosis in Graphs: Validator Parity
There is definitely a non-normal spread of voting power among validators. That's not necessarily a bad thing. This is not a critique of anyones staking selection or of any validators in general! Currently, there's no incentive to stake w/ a smaller validator aside from your own desire to decentralize voting power and support the individal validators efforts. Larger validators have pre-established reputations and are trusted for that reason.
Validator Power
I was inspired by a lot of the recent Prop 120 discussions and a recent post by u/Gohodoshii plus the spreadsheet u/JohnnyWyles maintains
To assist in these discussions, I decided to bring out the relevant stats and graphs to demonstrate the lack of symmetry in voting power. In Statistics, a lot of things are compared to the Normal Distribution (AKA Bell Curve). There are two metrics that indicate how far off a set of numbers, in this case voting power of validators, is from the Normal Distribution.
The first of these metrics is skew. Skew tells us how symmetrical a set of numbers is. The more skewed the numbers, the higher or lower the skew is depending on how it's skewed. Typically, any skew greater than 1 or less than -1 is considered "highly skewed" (Though some people permit skews up to 3/-3, we don't need to sweat that too much here). Here is the Skew of the Osmosis Validator Set:
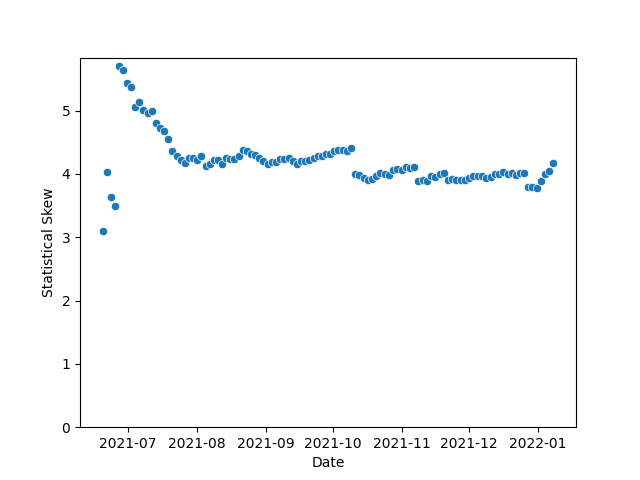
Note that for the most part, we sit around 4. That's highly skewed. This indicates that the mean or average voting power for a validator is much higher than the median. You can see that here:
Mean: 681939
Median: 184210
What's the difference between the mean and median? Think of the mean as a completely even splitting up of the votes/staked Osmos. If we gave all the validators the same number Osmos from the currently staked amount, they'd all have ~682k Osmos staked to them. But the median tells us that half the validators actually have less than ~184k Osmos, roughly 1/4th of that mean.
That large difference is demonstrated by our skew!
While the skew looks at the middle of our set of numbers - the median and mean, the kurtosis looks at the extremes, also known as the tails. In a bell curve, 99% of data points occur within 3 standard deviations of the median/mean. . The normal distribution/bell curve has a kurtosis of 3, so anything higher than that would indicate that we have more voting power in the edges of our dataset (i.e. smaller validators or larger validators) than in a bell curve. That said, lets take a look at Osmosis today:
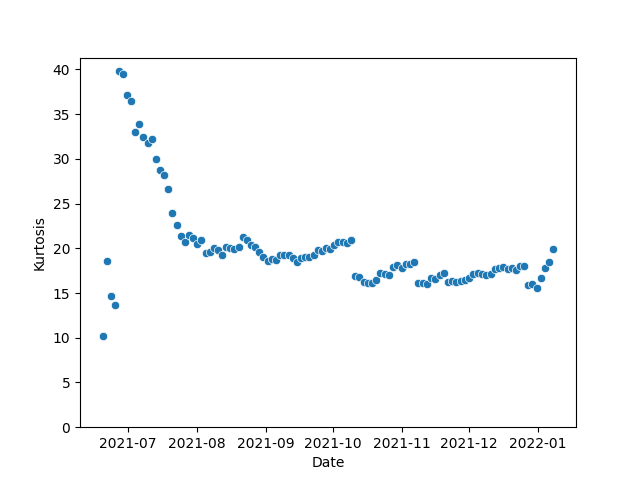
In Statistics, we sometimes refer to those edge numbers as the tails of a distribution. And in this case, we'd call these some pretty fat tails. There's definitely been a thinning out of the edges over time though, so perhaps that will continue to be the case as we go through 2022.